
In this tutorial, you will learn how to normalize data in Excel.
The phrase “normalization” itself has become a buzzword among experts in a variety of disciplines, including statistics, data science, machine learning, and more. Scaling down data that fall inside a particular range is known as normalization.
When dealing with big amounts of data or data of different scales, normalization is an excellent technique as it helps to reduce the size of the enormous amount of data and make it simple to draw conclusions and use the data correctly.
This data pre-processing approach can assists you in developing predictive models and identifying any relationships and connections between data sets.
Because it is frequently used interchangeably with another statistical term, standardization, by individuals and is commonly misunderstood, the word normalization became a buzzword. These phrases will be explained in this post, and we’ll learn how to use them on a sample dataset in Excel afterward.
Before moving to the tutorial, let’s familiarize ourselvess with the Excel functions we will be using to normalize data.
Table of Contents
Anatomy of AVERAGE, STDEV & STANDARDIZE Functions
AVERAGE Function
AVERAGE(number1, [number2], …)
The AVERAGE function returns the average or mean of a set of data.
STDEV Function
STDEV(number1,[number2],…)
The STDEV function estimates the standard deviation of a set of data.
STANDARDIZE Function
=STANDARDIZE(x, mean, standard_dev)
The STANDARDIZE function will return a normalized value (z-score) based on the mean and standard deviation.
Once ready, we’ll get started by utilizing real-world examples to show you how to normalize data in Excel.
Normalize Data in Excel
Before we begin we will need a group of data to normalize data in Excel.
Step 1
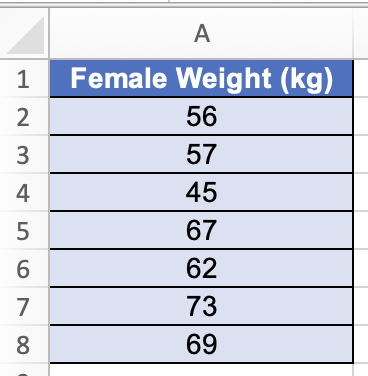
First, you need to have a clean and tidy group of data to work with.
Step 2
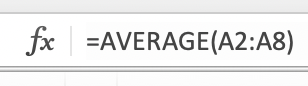
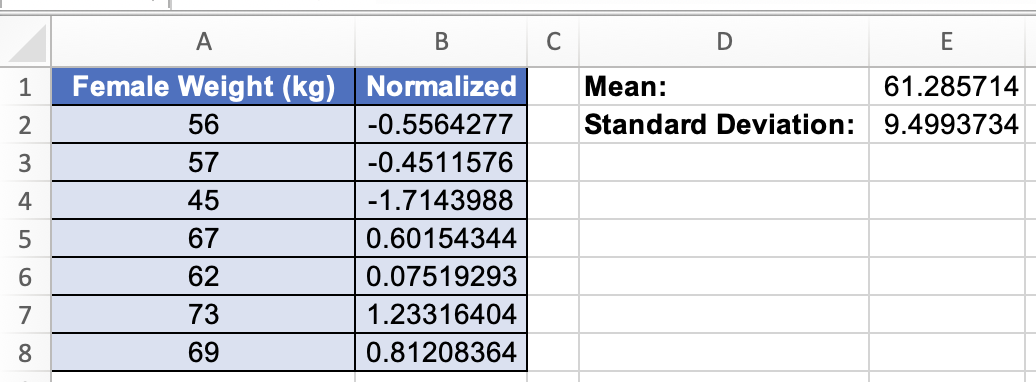
Then we will look for the mean of the data set by using the AVERAGE function. To do so, we will insert this formula =AVERAGE(A2:A8).
Step 3
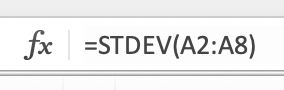
Then we will look for the standard deviation of the data set by using the STDEV function. To do so, we will insert this formula =STDEV(A2:A8).
Step 4
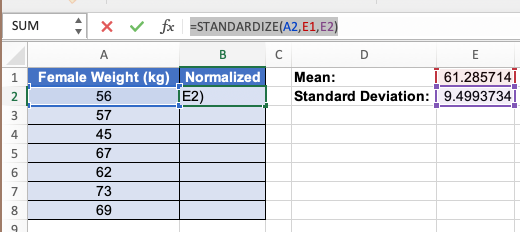
Now we can normalize each of the data by using the STANDARDIZE function. To do so, we will insert this formula =STANDARDIZE(A2,E1,E2).
Step 5
We can then apply the same formula to the rest of the data.
Interpret Normalize Data in Excel
A data point is greater than the mean if its normalized value is greater than 0, according to statistics. On the other hand, a normalized value of less than 0 denotes that the data point is below the mean.
The normalized number specifically informs us how far the original data point deviates from the mean.
For example, let’s use 73 kg as a sample. As the normalized data for 73 kg is 1.233, this means that 73 kg is 1.233 standard deviation above the mean in the original dataset.
We can determine how close or far a specific data value is from the mean by comparing it to each of the normalised values in the dataset. A value is close to the mean if the normalised value is small, and it is distant from the mean if the normalised value is large.