In this tutorial, you will learn how to create a scatterplot with multiple series in Excel.
We may frequently need to combine numerous data series into a scatter plot. After producing this kind of scatter plot, the following step is to add labels to the chart to make it easier to interpret. By following a few simple procedures, we can add numerous series labels in Microsoft Excel.
Once you are ready, we can get started by using real-life scenarios to help you understand how to create a scatterplot with multiple series in Excel.
Table of Contents
Create a Scatterplot with Multiple Series
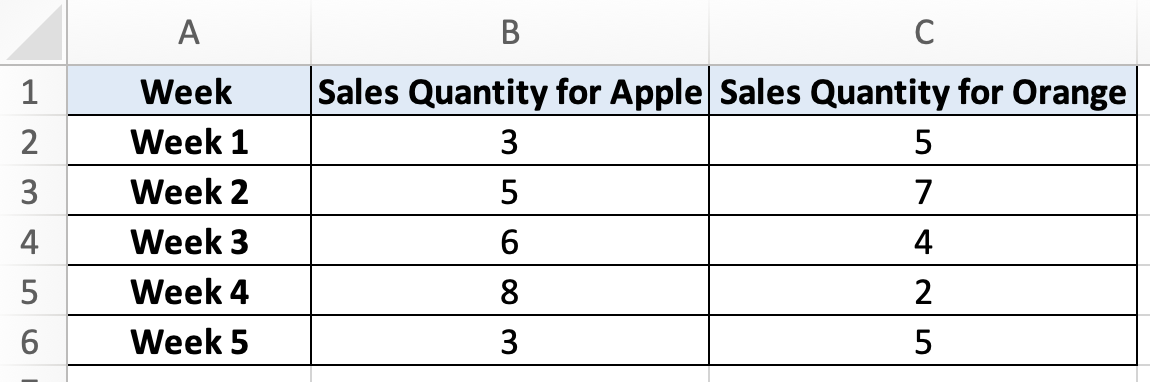
Before we begin we will need a group of data to be used to create a scatterplot with multiple series in Excel.
Step 1
Make sure your group of data is displayed in a clean and tidy manner in the first sheet.
Step 2
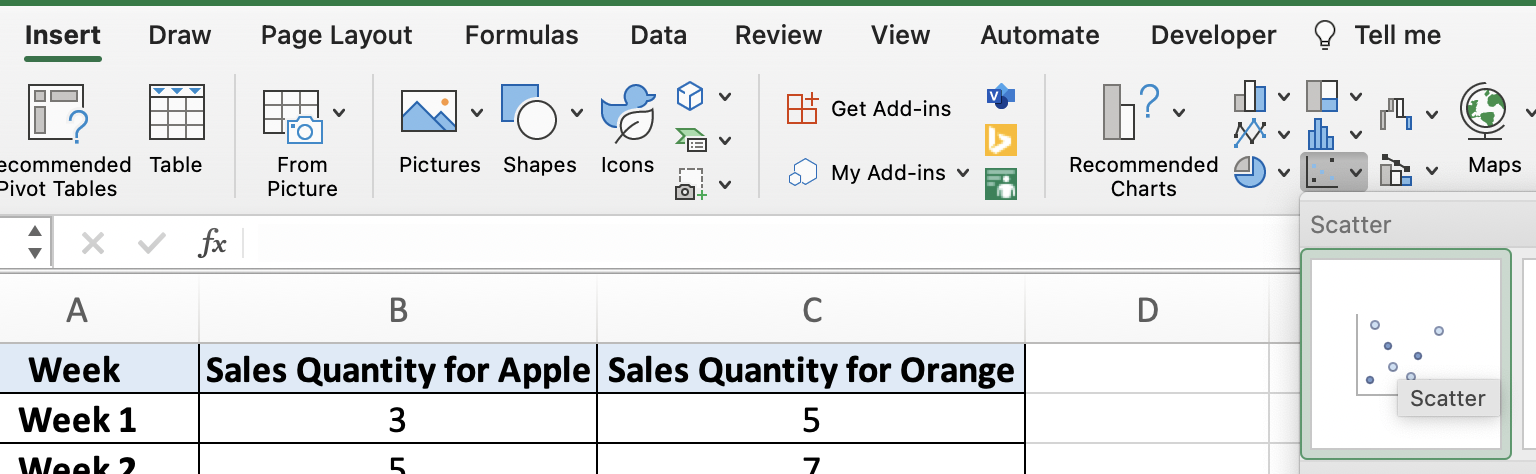
To create a scatterplot with multiple series, we will select the entire data group, select ‘Insert’ and select ‘Scatter Plot’.
Step 3
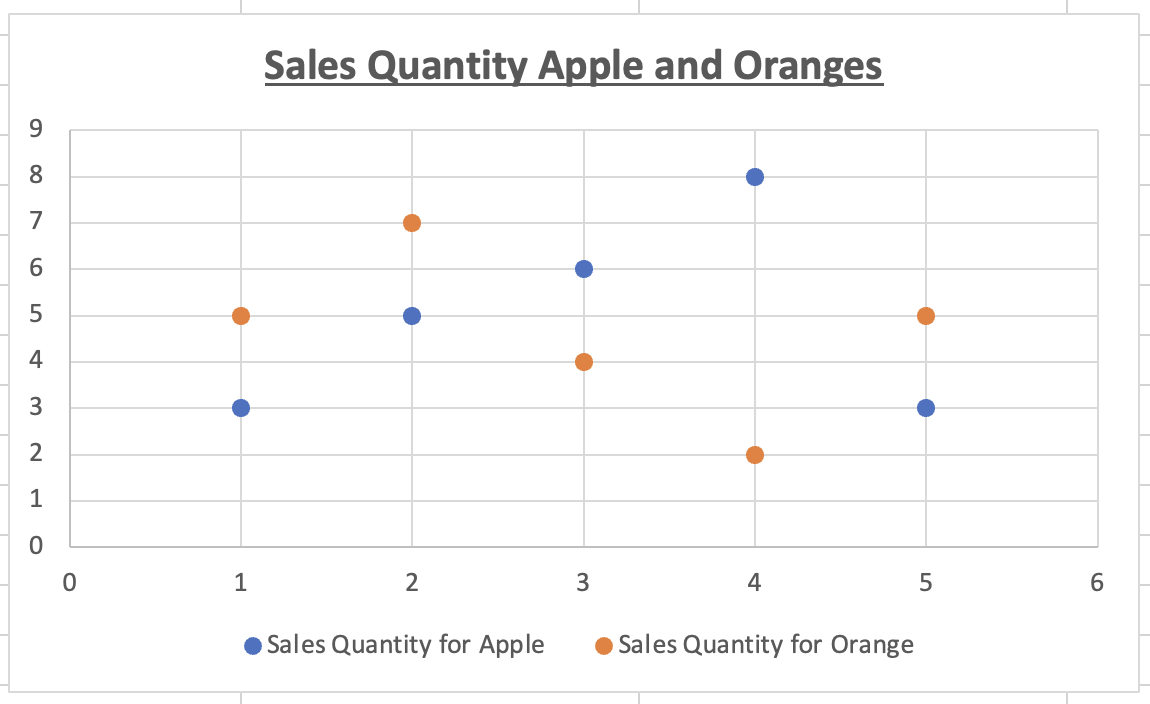
Once you are done, your chart will look like this.