
In this tutorial, you will learn how to calculate relative frequency in Excel.
A frequency distribution is the distribution of the frequency of occurrence of a set of events. In other words, a frequency distribution describes distinct values in a data set and how many times the values occur in the data set. A relative frequency distribution shows the occurrence of an event as a percentage of the total number of occurrences of all events in a particular set of events. In other words, the relative frequency distribution shows how often a value occurs in a dataset compared to the size of the dataset.
Once ready, we’ll get started by utilizing real-world examples to show you how to calculate relative frequency in Excel.
Table of Contents
Calculate Relative Frequency in Excel
Before we begin we will need a group of data to calculate relative frequency in Excel.
Step 1
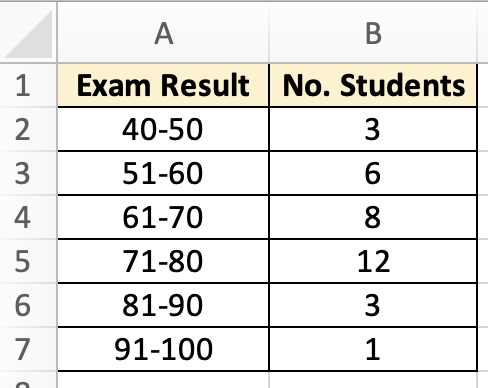
First, you need to have a clean and tidy group of data.
Step 2
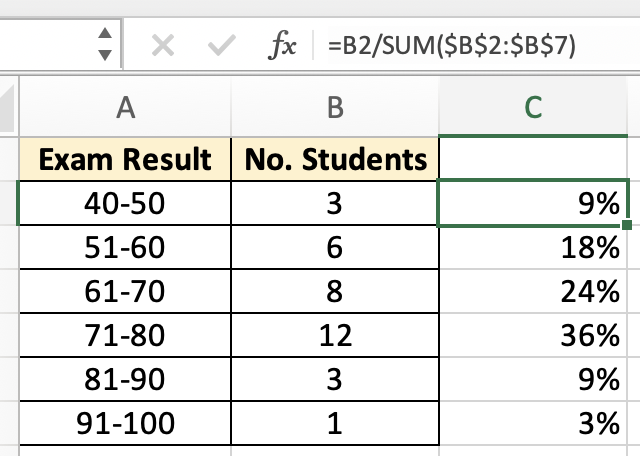
First, we will calculate relative frequencies for each class. This is the frequency of each class expressed as a percentage of the whole by inputting this formula =B2/SUM($B$2:$B$7).
Step 3
A total of 33 students took the exam. Therefore, we determined the relative frequency of each class by taking the frequency of each class and dividing by the total number of students.