
In scientific and technical fields, the percent error is a measure of the accuracy of a measurement or calculation.
It is defined as the difference between the measured value and the true value, divided by the true value and multiplied by 100%.
In this blog post, we will show you how to calculate percent error in Excel.
We will also provide some tips on how to minimize errors in your measurements.
Happy calculating!
Table of Contents
How to Calculate Percent Error in Excel
Google Sheets and Excel have similar functions.
This means that they also work similarly.
The methods for calculating percent error in Excel are the same as the ones utilized in Google Sheets.
Method 1. Calculating Percent Error Using Cell Locations
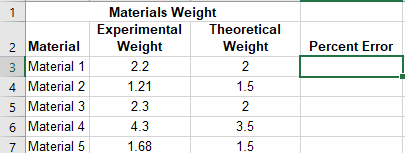
The dataset contains the experimental weight and theoretical weight of several materials.
We now have to look for the percent error to determine how much these values vary.
Step 1. Open your Excel workbook

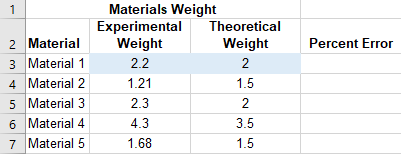
Step 2. Click the cell you want the percent error to appear
The selected cell should appear with a dark green border.
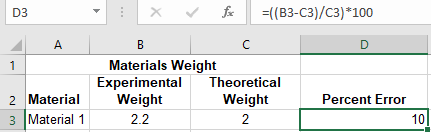
Step 3. Locate the coordinates of your cells
Locate the significant cell coordinates.
Essential values are in Columns B and C.
Since we will start with Material 1, the notable cell locations are B3 and C3.
Step 4. Input the percent error formula
As mentioned previously, the actual formula of percent error is:
(Experimental Value – Theoretical Value)/(Theoretical Value) x 100
Thus, we have to create a formula accepted by Excel.
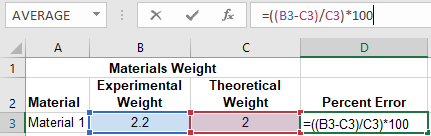
Based on the above percent error formula and the coordinates of the cells we want to calculate, the formula you have to input into the formula bar of Excel is:
=((B3-C3)/C3)*100
Where: B2 and C3 are cell coordinates
/ is the division symbol
* is the multiplication symbol
100 is used to convert the value to percent
Step 5. Press “Enter” on your keyboard
Clicking “Enter” on your keyboard should automatically execute the formula.
The percent error will appear on the cell you initially selected.
Step 6. Copy the formula to the remaining cells
To copy the formula, drag the fill handle from the first cell down to the last.
The fill handle is a dark green square found at the lower right corner of your selected cell.
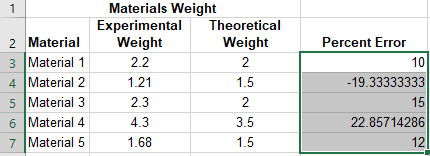
Note: You’ll know when you’re hovering on the correct area if your cursor turns into a plus symbol.
Method 2. Calculating Percent Error Using Exact Values
This method is just like the first one.
The only difference is how you input the formula.
Instead of using the cell locations, you will use the specific values in computing.
Note: This method is for computing only one or a few values as you cannot copy the format to other cells.
Thus, these are the values we will use as an example.
Step 1. Open your Excel workbook
Step 2. Click the cell you want the percent error to appear
The selected cell should appear with a dark green border.
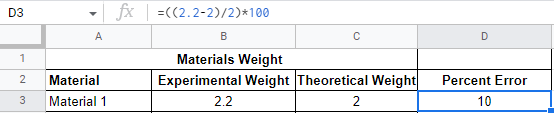
Step 3. Input the percent formula
Based on the actual formula of percent error and the values in this dataset, the formula should be:
=((2.2-2)/2)*100
Where: 2.2 and 2 are the specific values
/ is the division symbol
* is the multiplication symbol
100 is used to convert the value to percent
Step 5. Press “Enter” on your keyboard
Clicking “Enter” on your keyboard should automatically execute the formula.
The percent error will appear on the cell you initially selected.
Conclusion
Using Google Sheets and Excel to calculate percent error or the difference between experimental and known values follow the same steps.
The formula in these applications relies on the initial procedure for finding the percent error between different values.
This article breaks down the steps for this desired calculation and briefly explains the creation of the utilized formulas.
Summary
That’s the end of this tutorial.
We hope this article helps you learn how to calculate Percent Error in Excel