In this tutorial, you will learn how to calculate Mean Absolute Percentage Error in Excel.
In statistics, the term “forecasting accuracy” is frequently used to describe how closely a quantity matches its actual value. The true value is another name for the actual value. It essentially refers to the degree of similarity or a verification method that is heavily utilised by company experts to keep track of their sales and exchanges in order to maintain the demand and supply mapping every year. There are several ways to figure the forecasting accuracy.
Hence, one of the most used techniques for determining forecasting accuracy is MAPE, or Mean Absolute Percentage Error. It is a more efficient and practical way because it is simpler to interpret accuracy by looking at the MAPE value alone.
Once ready, we’ll start by utilizing real-world examples to show you how to calculate Mean Absolute Percentage Error in Excel.
Table of Contents
Mean Absolute Percentage Error Formula
MAPE = (1/n) * Σ([actual – forecast] / [actual]) * 100
Where:
n is the number of fitted points,
At is the actual value,
Ft is the forecast value.
Σ is summation notation (the absolute value is summed for every forecasted point in time).
Calculate Mean Absolute Percentage Error in Excel
Before we begin we will need a group of data to calculate Mean Absolute Percentage Error in Excel.
Step 1
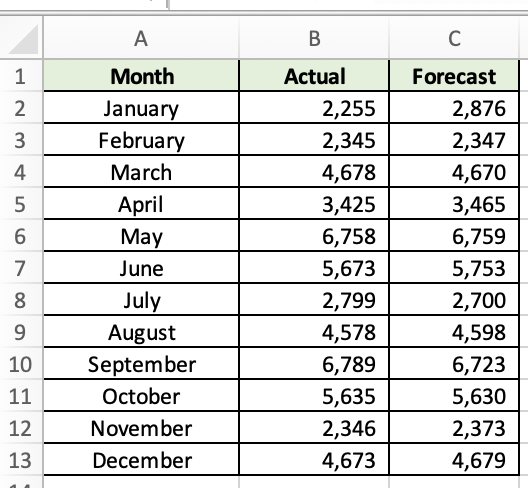
First, you need to have a clean and tidy group of data.
Step 2
We will need to calculate the absolute percent error for all rows. We will use this formula =ABS(B2-C2)/B2*100.

Step 3
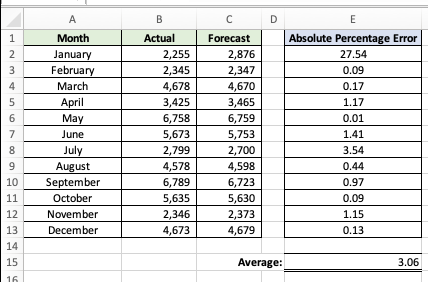
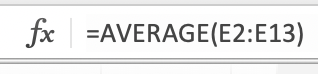
Once you have calculated the absolute percent error for all rows, we will then calculate the average of all the absolute percent error. We will use this formula =AVERAGE(E2:E13).
Step 4
Once you are done, your sheet will look like this.