In this tutorial, you will learn how to create progress bars in Excel.
For example, the progression of a lengthy computer process, such as a download, file transfer, or installation, is visualized using a progress bar, a graphical control element. Occasionally, a written representation of the progress in % format is included with the visual.
We can use the bar chart to show the progress bars.
Once you are ready, we can get started by using real-life scenarios to help you understand how to create progress bars in Excel.
Table of Contents
Creating a Progress Bar
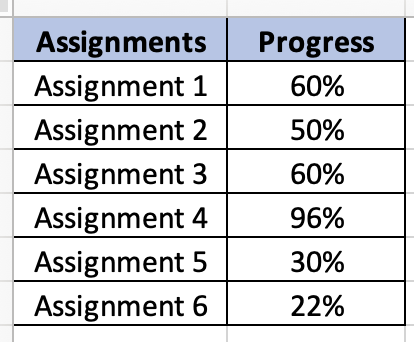
Before we begin we will need a group of data to be used to create the progress bars.
Step 1
Make sure your group of data is displayed in a clean and tidy manner. This will help us to create a progress bar easily.
Step 2
Select the entire data cell, choose ‘Insert’, and select ‘Clustered Bar’.

Step 3
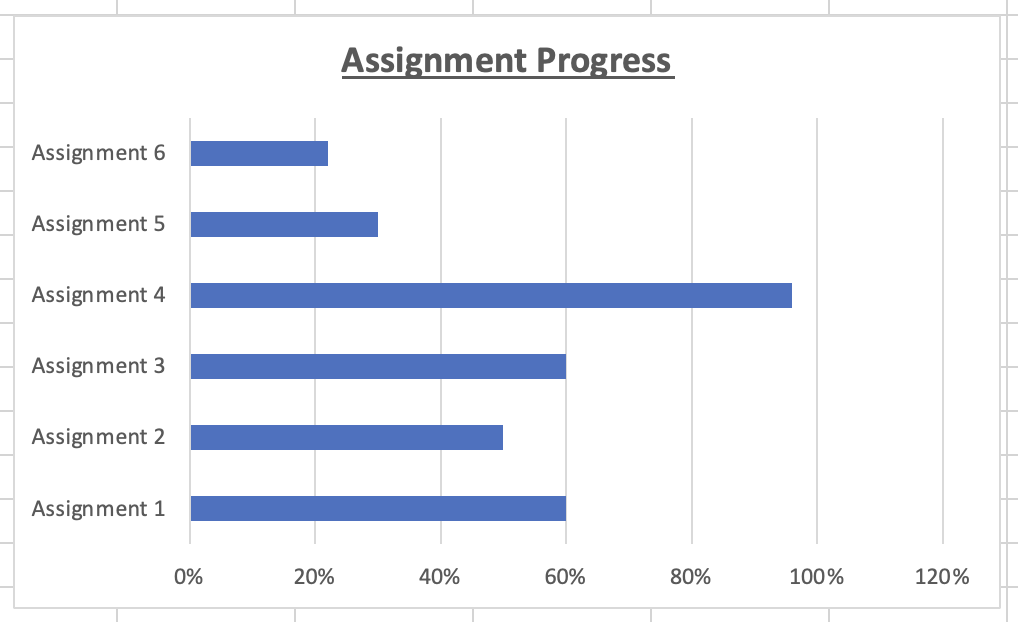
Now, you can customize the progress bar chart to your preference. We will change the chart title to ‘Assignment Progress’ to better represent the progress chart.
Step 4
Once you are done editing and customizing the progress bar chart, it will look something like this.