In this tutorial, you’ll learn how to calculate variance in Google Sheets.
Variance is a measure of dispersion or variability of a set of data points from their mean value.
By calculating variance, you can get an idea of how spread out your data is and whether it’s relatively consistent or not.
Let’s get started!
Table of Contents
How to Calculate Variance in Google Sheets
Variance measures the extent to which data points spread out from the mean.
It indicates the degree of distribution of each data point from the standard.
There are two types of variances: sample and population.
Sample variance is based on sample data, while population variance is from an entire data population.
Spreadsheet applications like Google Sheets and Microsoft Excel use functions that execute computations by simply inputting the appropriate formula into the formula bar.
This is also true for variance calculations, as you can do them quickly using these two applications.
Calculating Variance in Google Sheets
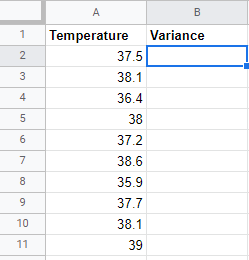
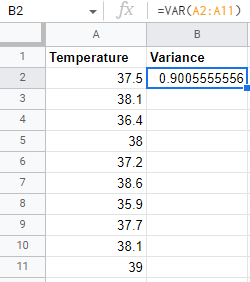
Suppose this is the dataset you will use for both sample and population variance computation.

Method 1. Calculating Sample Variance
Step 1. Load up your sheet

Step 2. Select the cell where you want the sample variance to appear
The selected cell should appear with a blue border.
Step 3. Locate the cell range of your data
Identify the cell range of your data by checking the cell coordinates.
The coordinates consist of a column letter and row number.
A cell range is then composed of the first and last cell coordinates separated by a colon.
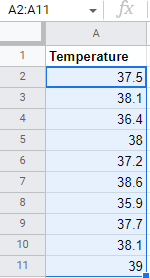
Thus, the cell range of your needed data is A2:A11.
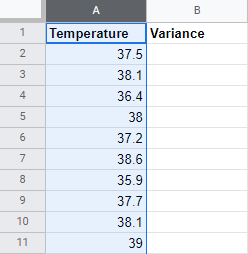
A more straightforward method to identify the cell range is highlighting it.
You can do this by clicking, holding, and dragging your mouse cursor over the field.
Doing this will automatically show the cell range beside the formula bar.
Step 4. Input the VAR formula
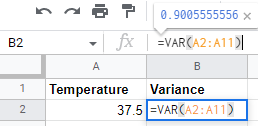
Since you are only going to compute the sample variance, the function to be utilized is VAR.
Input the following formula into the formula bar:
=VAR(A2:A11)
Step 5: Click “Enter” on your keyboard
Clicking enter should automatically add the sample variance into the cell you selected in step 2.
Method 2. Calculating Population Variance
This method utilizes the same steps as the computation for sample variance.
The only difference is the formula you have to input.
Step 1. Load up your sheet

Step 2.Select the cell where you want the population variance to appear
The selected cell should appear with a blue border.

Step 3. Locate the cell range of your data
Identify the cell range of your data by checking the column letter and row number.
The cell range of the data in this set is A2:A11.

Another method you can use is highlighting the entire cell range to view the coordinates. Click, hold, and drag your mouse cursor over the whole field to show the cell range.

Step 4. Input the VARP formula
Unlike the first method, which only uses the VAR function, this method utilizes VARP since it computes the entire data population.
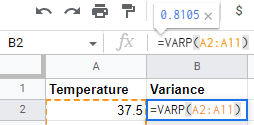
Thus, input the following formula into the formula bar:
=VARP(A2:A11)
Step 5: Click “Enter” on your keyboard
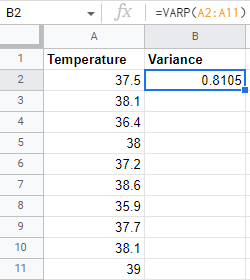
Clicking enter should automatically add the population variance into the cell you selected in step 2.
Summary
That’s the end of this tutorial.
We hope this article helps you learn how to calculate Variance in Google Sheets.
